A Power BI theme that passes a design review.
Sightline styles every Power BI visual from design tokens, in a calm, web-app look after shadcn/ui. Every build is checked for WCAG contrast before it ships.

Power BI defaults, replaced with a design system.
Import one file and every visual follows the same rules: one brand colour, quiet neutrals, hairline borders and type that sets the hierarchy.
Every visual type styled
45 visual types, the filter pane and the page, from one token file. Axes, legends and fonts are shared through the theme's wildcards.
Accessible by construction
Series colours clear WCAG 3:1 on the canvas, text clears 4.5:1. A build that misses either never reaches dist/.
Light and dark, one source
The dark variant overrides tokens, not templates, so a fix lands in both. Slot N names the same hue in both.
Presets with one vocabulary
Minimal, Labelled, Dense, Presentation and Comparison mean the same on every chart. Lines add Markers, Smooth, Step and Sparkline.
Tables that read like a web app
Muted headers, row hairlines, a footer band for totals, and theme versions of every built-in table style, plus Bordered.
Built like software
Plain JSON templates with a strict resolver, a schema gate, a design linter, CI, and a preview report to check every change.
Eight series colours, checked on every build.
Read from the theme tokens when this page was built. The contrast is measured against the page canvas, the harsher of the two surfaces. The swatches follow your system setting: switch between light and dark mode to see the other palette.
Every visual type, on fictional data.
The repository includes a Power BI project with a page per visual family. Presets: Minimal, Labelled, Dense, Presentation, Comparison, Markers, Smooth, Step, Sparkline.
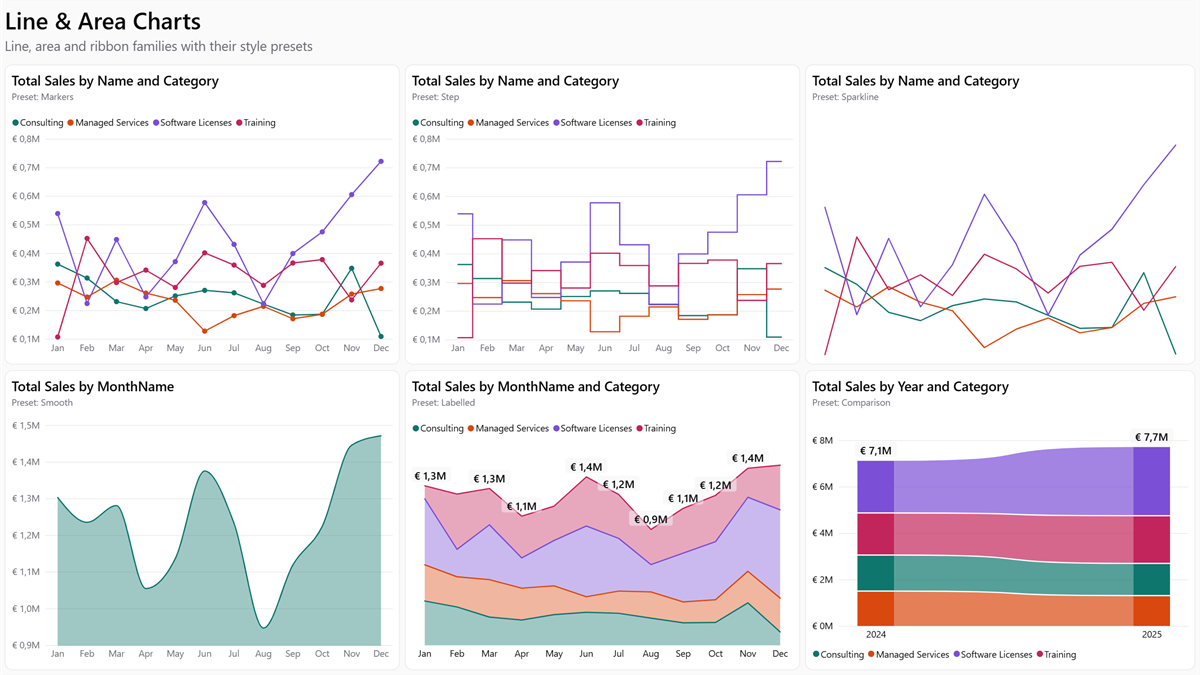
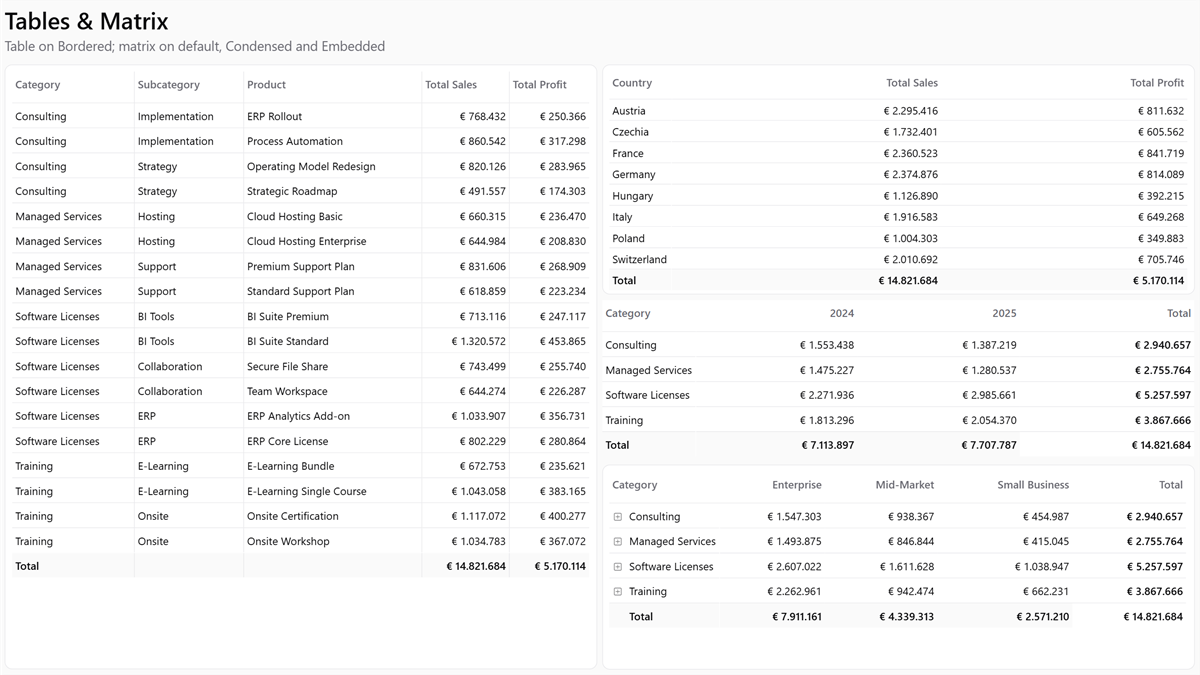
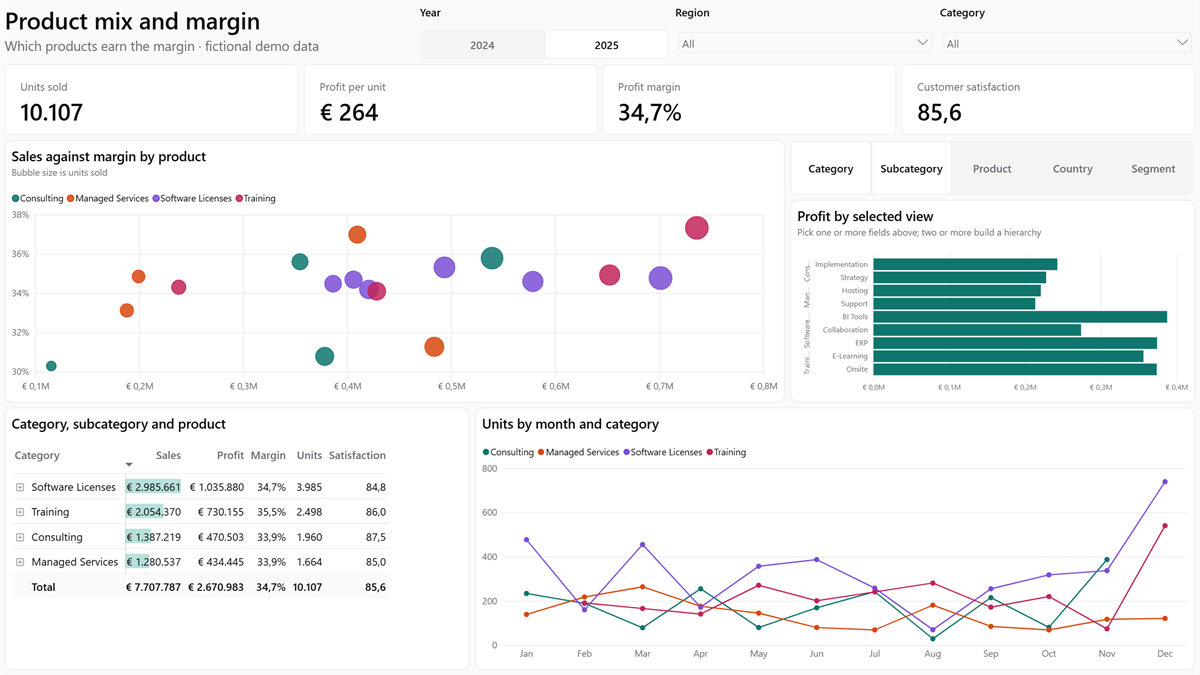
Two minutes, no build.
- 1Download
theme.json for light, theme.dark.json for dark.
- 2Import
In Power BI Desktop: View → Themes → Browse for themes.
- 3Pick presets
Choose a style per visual in the format pane, for example Minimal next to a hero chart.
Change the tokens, keep the guarantees.
npm install
npm run build
Put your brand colours into src/variables.json and their dark values into src/themes/dark.json. The build fails with the token, the measured value and the threshold if a colour is not readable. Read the reference.
Why not just …?
The questions this approach usually gets, answered.
Why not edit a theme JSON by hand, or use Power BI's Customize theme dialog?
The dialog covers colours, fonts and a few visual defaults. It has no presets, no per-object styling and no dark variant. A hand-edited file for 45 visual types runs to thousands of lines. A light and a dark copy of it drift apart with the first fix.
Why not use an online theme generator?
Generators are good for picking colours. Sightline is about what comes after: contrast that is
checked rather than hoped for, a dark variant from the same source, and presets per chart type.
If you like a generator's palette, put its colours into src/variables.json and let the gate
tell you which ones are readable.
Why not Style Dictionary or the W3C design-token format?
The tokens are the small part, about a hundred values in one JSON file. The real work is
mapping them onto Power BI's objects for 45 visual types, and a token pipeline would still need
that mapping. If your organisation already exports tokens, write them into src/variables.json.
Why not a template engine such as Handlebars, Jsonnet or CUE?
The templates are plain JSON in which a value can be "{{token.path}}". The resolver keeps
the token's JSON type (numbers stay numbers, colour objects stay objects) and stops on unknown
tokens, cycles and duplicate keys with the file and path. It is about 160 lines in
scripts/lib/tokens.js, and the only runtime dependency of the
whole build is Ajv for the schema check.
Why not put everything in the * wildcards?
Shared objects do live there: the base font in visualStyles["*"]["*"]["*"], and the axes,
legend and container chrome in visualStyles["*"]["*"]. A visual file only states what differs.
Data labels stay per visual, because their shared default (show: false) would also hide the
labels of treemaps, maps and gauges. The move was checked by comparing screenshots of every
preview page before and after; they were pixel-identical. See
Wildcards.
Why not APCA instead of WCAG 2 contrast?
WCAG 2.x is the standard that accessibility rules such as EN 301 549 and Section 508 point
to. APCA is still a draft for WCAG 3. The thresholds are in one place
(FLOOR in scripts/lint-design.js) if you need different ones.
Why not drop shadows and rounded bars, like the web UIs this is modelled on?
Power BI renders shadows coarsely and has no corner radius for bars. Cards are separated by a hairline instead, and the design gate rejects a global shadow.
Why not a .pbix for the preview?
A Power BI project (PBIP) is text, so a change to the preview shows up as a readable diff in a pull request.
Ship reports that look designed.
Free and open source under the MIT licence.